Architecture - Reference Manual - Guides
| ChibiOS/RT Architecture - Reference Manual - Guides |
Compiling and debugging ChibiOS/RT applications using Eclipse.
This article will explain how to use an Eclipse based toolchain (see Setting up a free embedded IDE) to develop ChibiOS/RT based applications. This guide will allow you to:
This guide assumes knowledge in following areas:
In general this guide is not a replacement for the Eclipse, GCC, Make, binutils, newlib, GDB, OpenOCD user manuals, the guide simply aims to give you a faster start.
This guide requires:
The first step is to import a project into the Eclipse environment. ChibiOS/RT demos do not include Eclipse project files but just a normal Makefile. Eclipse is able to import a Makefile project and create its own project file so this is not a problem. This is how it is done:
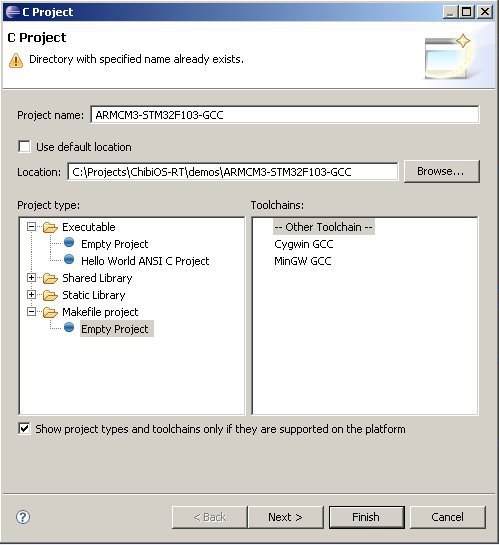
If you want to create a new application it is recommended that you create a Makefile project first then you can import it into eclipse using the above procedure. Makefile projects have the advantage that can be compiled everywhere even without Eclipse. Creation steps:
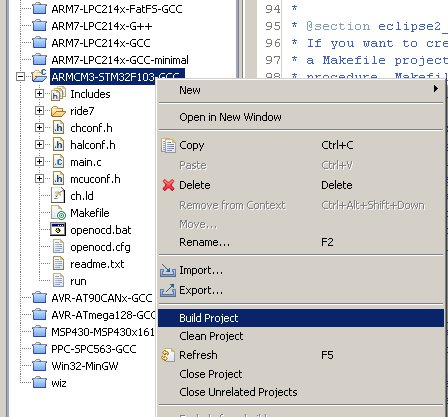
Once imported, an application can be compiled by using the "Build All" in the toolbar or by right clicking on the project and selecting "Build
Project". In order to clean a project (removing all the temporary and binary files) right click on the project and select "Clean Project".
The compilation result is visible as a complete log in the "Console" window, the detail of all errors an warnings is available in the "Problems" window.
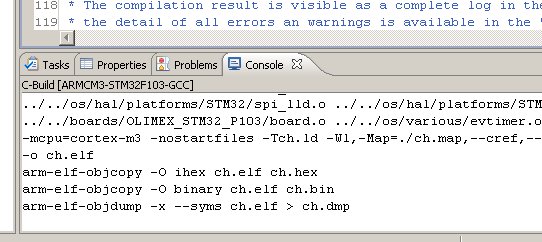
The build process produces the binary files specified in the Makefile, all the ChibiOS/RT demos produce binary files named ch.elf, ch.bin and/or ch.hex. The image must be loaded on the target board in order to execute it. The build process usually creates also some other useful files containing details about the built application (usually named ch.map and ch.dmp).
In order to debug your application a debug configuration must be created. The configuration instructs GDB (the source debugger used by Eclipse) on how to load the image, load the symbols and place the initial breakpoint in the make function. Note that GDB performs its function by connecting to a "GDB server", the DGB server implements the low level communication with the target device through the JTAG probe. In our scenario the GDB server functionality is performed by OpenOCD, this mean that OpenOCD must be running while performing a debug session within Eclipse.
A target specific debug configuration is required in order to:
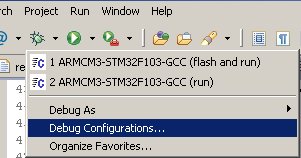
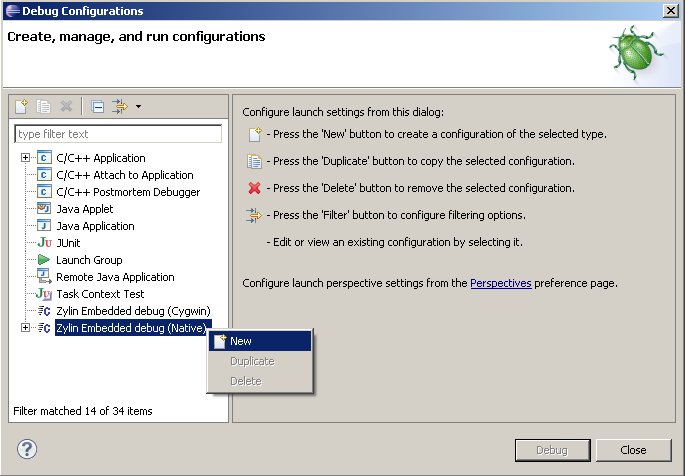
The first thing to do is to open the "Debug Configurations..." dialog:
The configuration dialog will appear, we must create a native Zylin configuration:
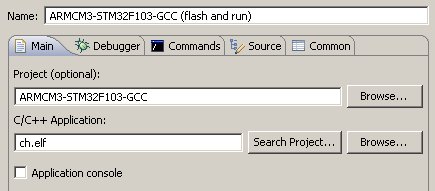
Now we must give the configuration a name, "ARMCM3-STM32F103-GCC (flash and
run)" in this example, then setup the various configuration pages as follow:
The "Main" tab:
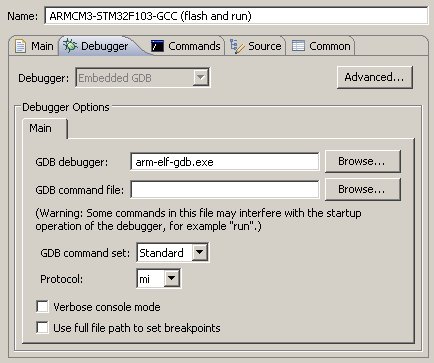
The "Debugger" tab:
The "Commands" tab:
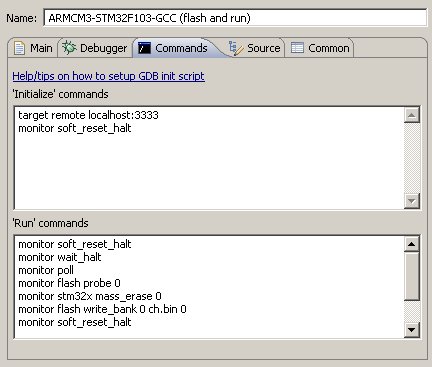
Note that the "Commands" tab contains the part that changes depending on the target. The complete commands sequence (it is not fully visible in the image) for STM32 is:
 monitor soft_reset_halt
 monitor wait_halt
 monitor poll
 monitor flash probe 0
 monitor stm32x mass_erase 0
 monitor flash write_bank 0 ch.bin 0
 monitor soft_reset_halt
 symbol-file ch.elf
 thbreak main
 continue
The "Common" tab:
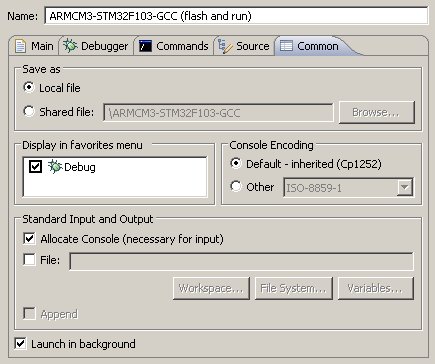
Now the debug configuration is complete.
OpenOCD must be run, with appropriate parameters, before starting your debug session. Please refer to the OpenOCD documentation in order to properly launch it for your target.
**To be completed**
Now we are ready to debug an application on the target. Note that Eclipse have a mechanism called "Perspectives", you edit and compile your source code while you are in the "C/C++ perspective" while the debugging is performed in the "Debug perspective". You can switch perspective at any time, even while there is an active debug session. If you install more of the many Eclipse extension plugins (there are thousands) you may have even more perspectives available.
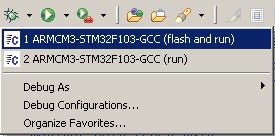
In order to start a debugging session first make sure that OpenOCD is running then press the drop down menu on the right side of the debug icon in the toolbar (the small green bug) and select your debug configuration (we created just one but you may have multiple debug configurations in your project, as example I usually create another debug configuration that just starts the target without uploading the code).
The debugger will be initialized, you will see the operation in progress on the console then Eclipse will switch to the debug perspective and you will see your program stopped on the default breakpoint in the main function.
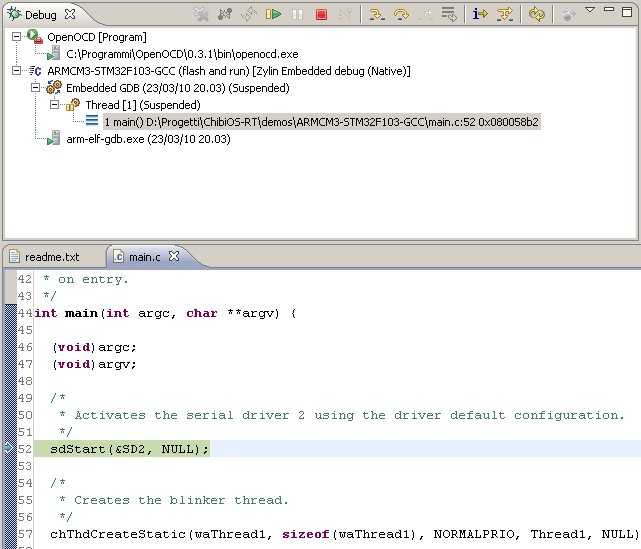
From there you can perform all the usual debugging tasks, set breakpoints, single step execution, variables, memory and registers inspection etc. Please refer to the Eclipse documentation about those "normal" operations. Note that if the debugging start procedure hangs then there is probably an error in your configuration or problems with the target, read the console log and/or the OpenOCD output in order to understand where the problem is.
From the debug perspective press the stop button (small red square) in the debug window, the target will be stopped and you may both return to the C/C++ perspective or start it again.
 1.6.3
1.6.3