3.8 KiB
Support HackTricks and get benefits!
Do you work in a **cybersecurity company**? Do you want to see your **company advertised in HackTricks**? or do you want to have access the **latest version of the PEASS or download HackTricks in PDF**? Check the [**SUBSCRIPTION PLANS**](https://github.com/sponsors/carlospolop)! Discover [**The PEASS Family**](https://opensea.io/collection/the-peass-family), our collection of exclusive [**NFTs**](https://opensea.io/collection/the-peass-family) Get the [**official PEASS & HackTricks swag**](https://peass.creator-spring.com) **Join the** [**💬**](https://emojipedia.org/speech-balloon/) [**Discord group**](https://discord.gg/hRep4RUj7f) or the [**telegram group**](https://t.me/peass) or **follow** me on **Twitter** [**🐦**](7af18b62b3/\[https:/emojipedia.org/bird/README.md)[**@carlospolopm**](https://twitter.com/carlospolopm)**.** **Share your hacking tricks submitting PRs to the** [**hacktricks github repo**](https://github.com/carlospolop/hacktricks)**.** Start searching for malware inside the pcap. Use the tools mentioned in Malware Analysis.
Volatility
The premiere open-source framework for memory dump analysis is Volatility. Volatility is a Python script for parsing memory dumps that were gathered with an external tool (or a VMware memory image gathered by pausing the VM). So, given the memory dump file and the relevant "profile" (the OS from which the dump was gathered), Volatility can start identifying the structures in the data: running processes, passwords, etc. It is also extensible using plugins for extracting various types of artifact.
From: https://trailofbits.github.io/ctf/forensics/
Mini dump crash report
When the dump is small (just some KB, maybe a few MB) the it's probably a mini dump crash report and not a memory dump.

If you hat Visual Studio installed, you can open this file and bind some basic information like process name, architecture, exception info and modules being executed:

You can also load the exception and see the decompiled instructions

Anyway Visual Studio isn't the best tool to perform a analysis in depth of the dump.
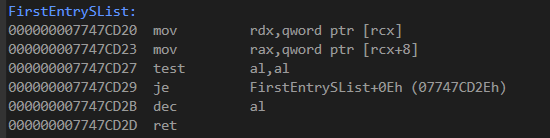
You should open it using IDA or Radare to inspection it in depth.
Support HackTricks and get benefits!
Do you work in a **cybersecurity company**? Do you want to see your **company advertised in HackTricks**? or do you want to have access the **latest version of the PEASS or download HackTricks in PDF**? Check the [**SUBSCRIPTION PLANS**](https://github.com/sponsors/carlospolop)! Discover [**The PEASS Family**](https://opensea.io/collection/the-peass-family), our collection of exclusive [**NFTs**](https://opensea.io/collection/the-peass-family) Get the [**official PEASS & HackTricks swag**](https://peass.creator-spring.com) **Join the** [**💬**](https://emojipedia.org/speech-balloon/) [**Discord group**](https://discord.gg/hRep4RUj7f) or the [**telegram group**](https://t.me/peass) or **follow** me on **Twitter** [**🐦**](7af18b62b3/\[https:/emojipedia.org/bird/README.md)[**@carlospolopm**](https://twitter.com/carlospolopm)**.** **Share your hacking tricks submitting PRs to the** [**hacktricks github repo**](https://github.com/carlospolop/hacktricks)**.**